BIOR Urban Digital Twins User Guide
This guide explains the research objectives, data sources, microclimate modelling, local climate zone analysis, and microclimate-informed urban building energy modelling behind the Singapore Urban Digital Twins platform.
About
This BIOR Urban Digital Twin is an interactive web-based platform for urban-scale microclimate-informed building energy analysis. It integrates building-level energy modelling, urban morphology, measured electricity-use intensity, local climate zone information, and WRF-derived microclimate fields.
Taking Singapore as the case study, the platform visualizes spatial variations in microclimate exposure and building energy demand at both individual-building and 500 m district scales. It supports exploratory analysis of how relatively hot, relatively cool, and transitional climate conditions influence energy use across building types and urban contexts.
Objectives and Research Questions
The platform is based on the Microclimate-Integrated Urban Building Energy Modeling (MUBEM) framework developed in the related research paper. The framework links urban climate simulation, multi-source geospatial data processing, building archetype assignment, and city-scale EnergyPlus simulation.
- Represent Singapore's building stock at individual-building and 500 m district scales.
- Translate WRF microclimate outputs into localized weather inputs for energy simulation.
- Compare energy use under non-microclimate and microclimate-informed conditions.
- Identify building types, LCZ contexts, and districts that are more sensitive to local climate exposure.
- Where do local microclimates most strongly change urban building energy demand?
- How do temperature, humidity, wind, and shortwave radiation affect different building archetypes?
- Which LCZ and district contexts show higher climate-energy sensitivity?
- How do simulated results compare with measured annual EUI records from Singapore's benchmarking data?
Data Sources and Processing
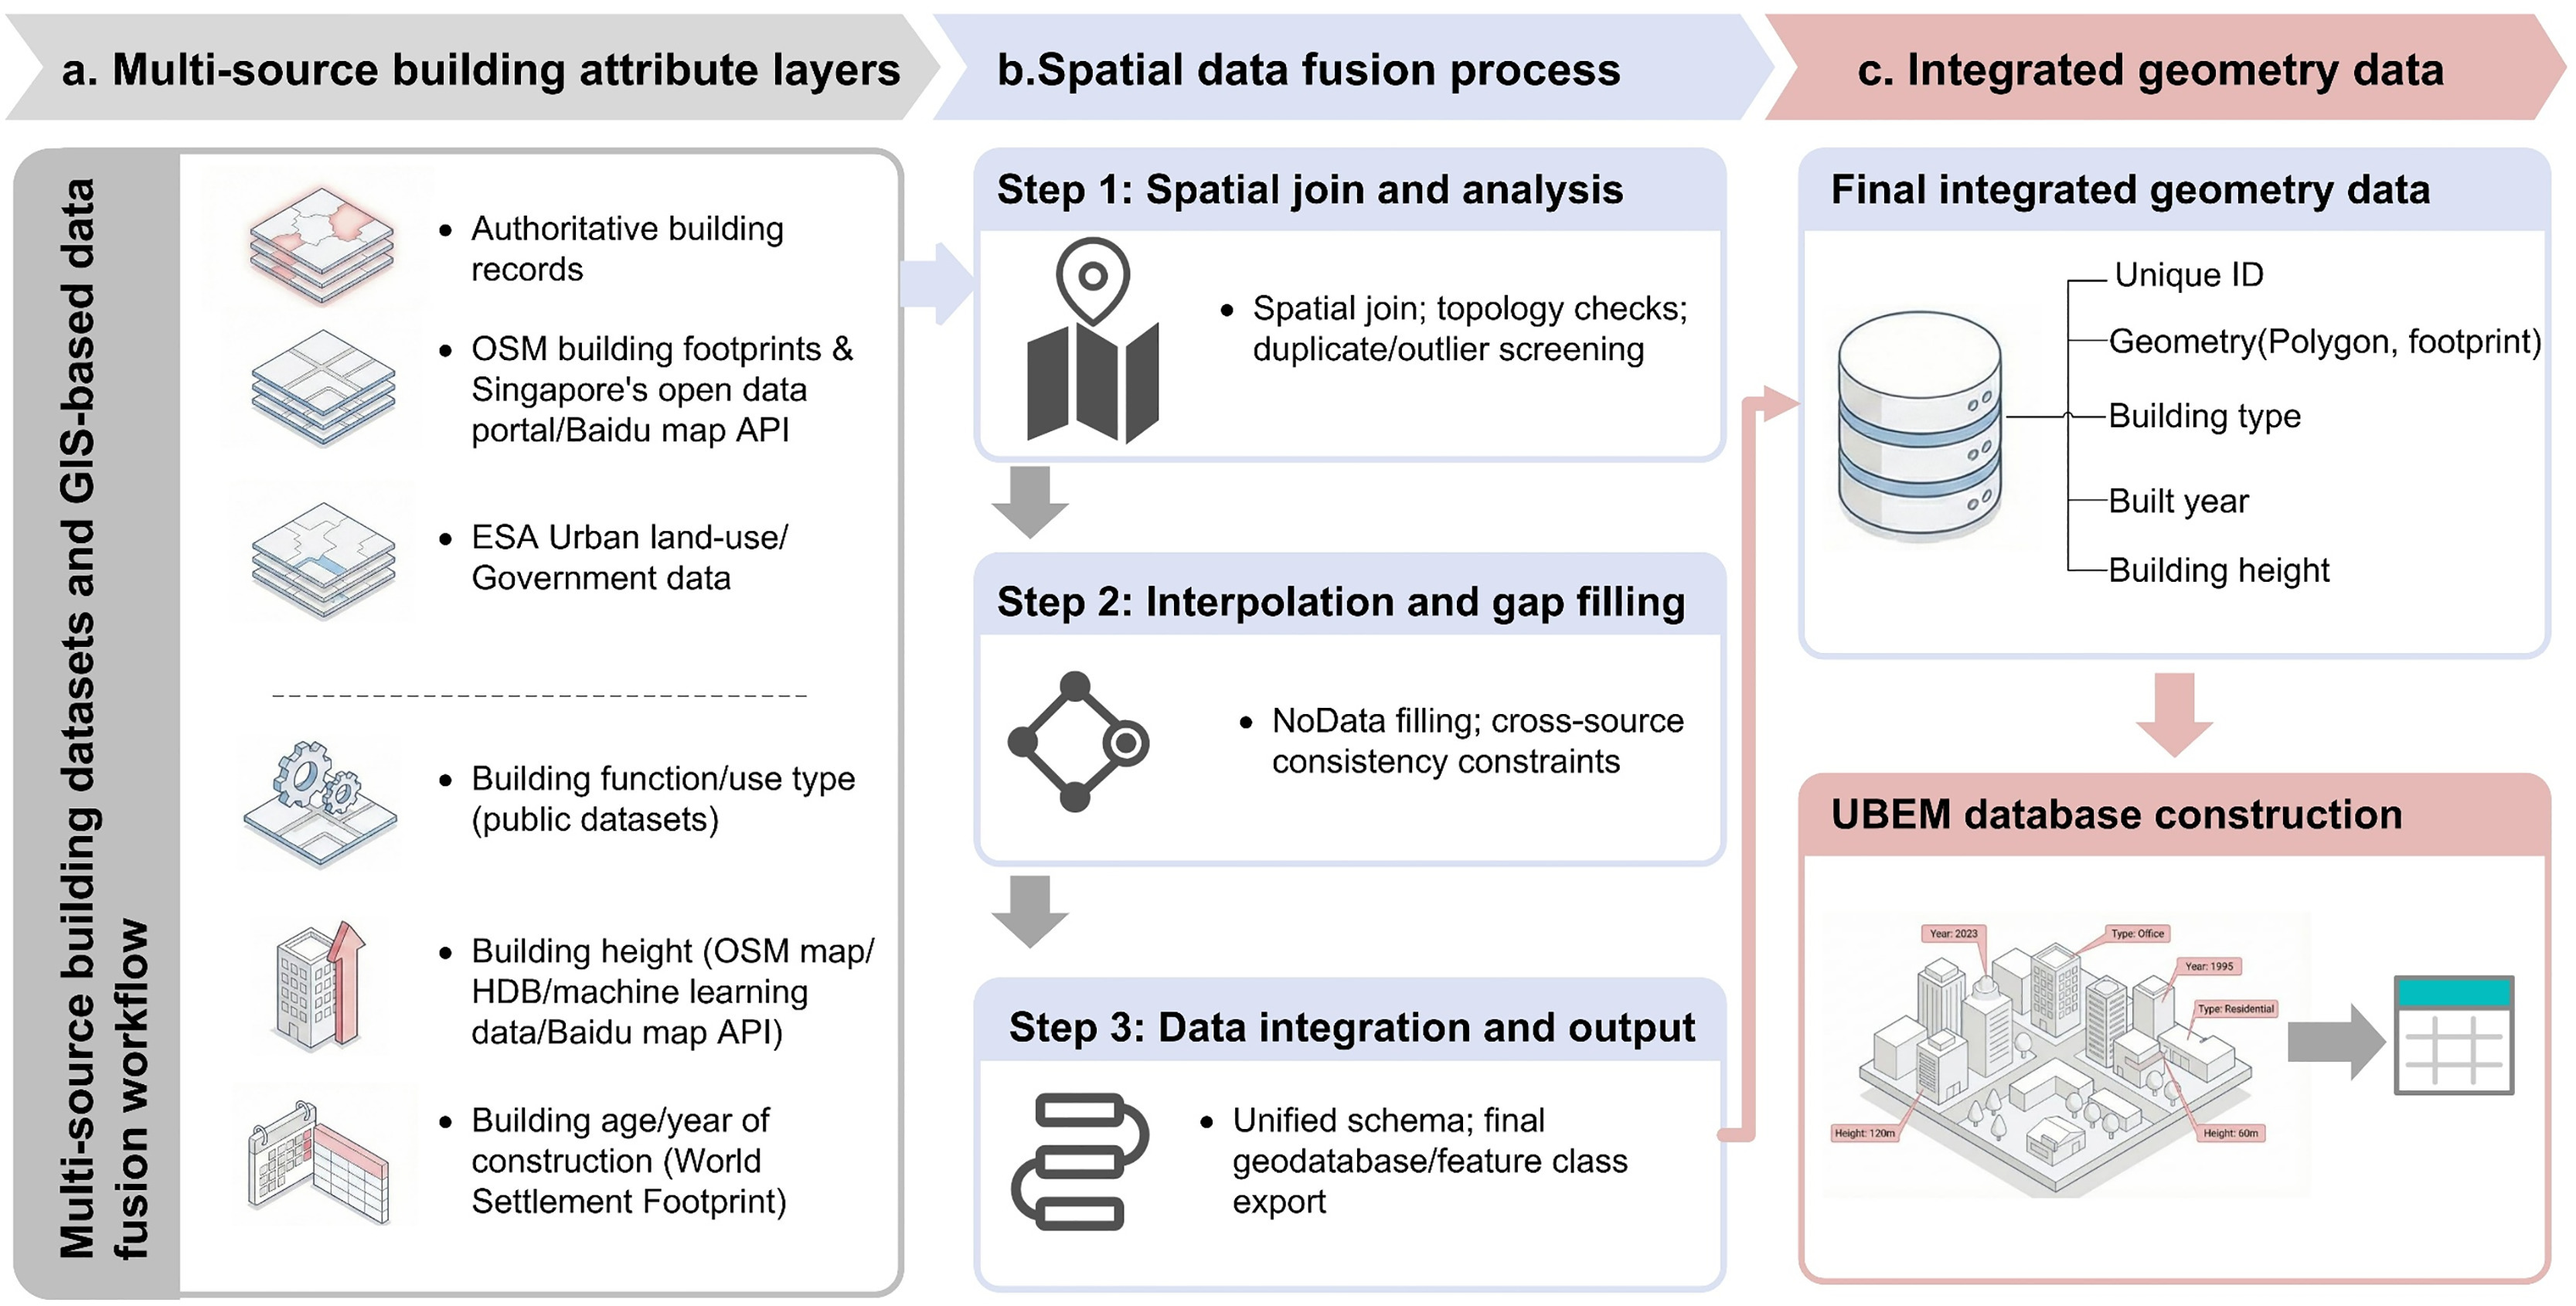
The web map visualizes processed research layers produced for the MUBEM study rather than raw source datasets. For Singapore, the building inventory was constructed with reference to the publicly released Buildings.city/Buildings.sg dataset documented by Lyu et al., and was further harmonized through our own multi-source data-fusion workflow. The resulting layers combine open geospatial data, public/government building records, machine-learning building-height products, WRF-derived microclimate simulations, and EnergyPlus modelling outputs.
Building geometry, height, type, and age
Singapore building footprints and initial attributes were based on the buildings.sg inventory, which integrates OpenStreetMap building footprints with HDB and BCA records and machine-learning-inferred archetype labels. In this study, the inventory was reprocessed for MUBEM simulation. Invalid footprints smaller than 20 m2 were excluded, and duplicated or topologically invalid records were screened before model construction.
Building height was not used as a single raw imported attribute. Instead, height information was assembled from available map attributes, HDB/public-housing records, government/open-data sources, and machine-learning-based height references such as UT-GLOBUS. Missing or inconsistent height values were completed using spatial overlap transfer, neighbourhood-based interpolation, and K-nearest-neighbor gap filling under cross-source consistency constraints.
Construction age was harmonized from available completion-year, TOP/CSC, public-housing, and built-environment age information. Where direct building-year records were unavailable, buildings were assigned to modelling vintage groups using the rule-based hierarchy adopted in this study.
- Main reference inventory for Singapore: buildings.sg (website and paper).
- Building footprints and volunteered map attributes: OpenStreetMap.
- Public-housing attributes, including completion year and floor information: HDB Property Information and HDB 3D data, where applicable.
- Commercial and public building benchmarking records: BCA Building Energy Benchmarking and Disclosure and BCA Building Energy Performance Data.
- Planning-use and address-matching context: URA Master Plan layers and OneMap services, where applicable.
- Supplementary land-cover and built-environment context: ESA WorldCover and DLR World Settlement Footprint Evolution.
- Machine-learning based building-height reference: GLObal Building heights for Urban Studies (UT-GLOBUS).
Building archetypes
Building archetypes were assigned through a multi-source matching and harmonization workflow rather than from a single authoritative attribute table. The Buildings.city/Buildings.sg labels were used as an important reference layer where available, and were further reclassified into the MUBEM energy-modelling categories used in this study. Additional cues from OSM tags, HDB records, BCA benchmarking records, planning-use context, address/building-name matching, height, age, and surrounding land-use context were used to resolve missing or ambiguous labels.
The web map displays the final processed research labels and simulation outputs; it does not redistribute the raw source datasets.
Urban context, population, and administrative boundaries
Population density and administrative boundaries provide contextual layers for district-scale interpretation and regional filtering. They are used as supporting spatial references rather than as direct inputs to the building-energy simulation.
- Gridded population-density context: WorldPop.
- Singapore national boundary and map-line reference: SLA National Map Line.
Weather, LCZ, and validation data
The climate and validation layers combine WRF simulation outputs, LCZ morphology, and observed weather or energy-performance references. Station observations from Singapore's National Environment Agency were used to assess WRF temperature, humidity, and wind simulations. BCA measured EUI records were used to validate and calibrate the annual baseline energy model.
- Weather station observations: NEA Realtime Weather Readings across Singapore.
- LCZ maps and urban morphology context: WUDAPT and WUDAPT data overview.
- Building energy benchmarking: BCA Building Energy Benchmarking Report 2023.
WRF Microclimate Data
The microclimate layers are derived from the Weather Research and Forecasting (WRF) Model, a mesoscale numerical weather prediction system widely used for atmospheric research and weather modelling. In this project, WRF v4.4 was coupled with the BEP/BEM urban canopy parameterization to represent urban surface processes and building-related heat exchange.
Representative climate periods
Singapore has a tropical rainforest climate with persistent cooling demand. Instead of winter and summer heating seasons, the platform uses three representative weeks based on long-term official meteorological conditions:
- Relatively hot season: May 16-22, representing the warmer May condition.
- Relatively cool season: December 21-27, representing the cooler December condition.
- Transitional season: October 16-22, representing a transition period between monsoon regimes.
Model resolution and variables
The WRF simulation used three nested domains over Singapore with grid sizes of 4.5 km, 1.5 km, and 0.5 km, 34 vertical levels, the Noah-MP land-surface model, and two-way nesting. LCZ information was used in the fine domain to improve urban surface representation.
- 2 m air temperature: near-surface air temperature, converted and displayed in degrees Celsius.
- 10 m wind speed: wind speed calculated from the east-west and north-south wind components.
- 2 m relative humidity: near-surface relative humidity derived from WRF humidity and pressure variables.
- Solar shortwave radiation: surface downwelling shortwave radiation from WRF.
From WRF to the map
WRF outputs are produced on a curvilinear numerical grid. The paper's workflow resampled these outputs to a 500 m spatial grid using nearest-neighbor/KD-tree processing, exported the results into GIS-ready layers, and converted them into web map tiles for interactive visualization. The hourly slider in the platform shows the representative-week variation of each microclimate variable.
Boundary-condition note
Two boundary-condition concepts are used in the workflow. At the atmospheric-model level, WRF is initialized and constrained by large-scale meteorological fields during preprocessing. At the building-energy level, the WRF-derived local variables above are inserted into grid-specific EPW weather files, so that each building can be simulated with a localized microclimate boundary condition rather than a single city-wide weather file.
LCZ Analysis
Local Climate Zones (LCZs) classify urban and natural landscapes into standardized thermal-morphological categories, such as compact high-rise, open mid-rise, low-rise, dense trees, low plants, bare soil, and water. LCZ information helps explain why districts with similar building functions may experience different microclimate and energy responses.
How LCZ is used here
- 100 m LCZ maps describe fine-scale urban morphology and land-cover context.
- 500 m dominant-LCZ layers summarize the main LCZ type for each district grid.
- LCZ composition statistics support interpretation of climate-energy sensitivity.
- The region filter can be used with LCZ layers to compare selected planning areas.
Interpretation
In the Singapore analysis, high climate-energy sensitivity is often associated with water, vegetation, bare-surface, and sparsely built contexts, especially during relatively hot and transitional periods. Dense built-up LCZs are not always the most sensitive because their local microclimate response depends on temperature, humidity, wind, solar exposure, building type, and operational schedule.
MUBEM Energy Model
The energy layers are produced with a Microclimate-Integrated Urban Building Energy Modeling workflow. The workflow converts GIS building attributes into EnergyPlus input files, assigns building archetype parameters, generates localized weather files, runs city-scale simulations, and aggregates the outputs to building and 500 m district scales.
Simulation engine and automation
The building energy simulations are based on EnergyPlus, the U.S. Department of Energy whole-building energy simulation engine. Python automation, including the eppy library, was used to edit IDF templates and batch-generate model inputs from GIS attributes.
Model inputs
- Building geometry: footprint, height, floor count, gross floor area, and shading context.
- Building archetype: use type, operation schedules, internal load densities, envelope properties, and HVAC assumptions.
- Weather: baseline typical meteorological year data and WRF-derived grid-specific EPW files.
- Validation references: BCA measured EUI data for selected commercial and public building categories.
Energy layers in the platform
- Weekly simulation data without microclimate for relatively hot, relatively cool, and transitional periods, reported as kWh/week.
- Weekly simulation data with WRF-derived microclimate for the same three periods, reported as kWh/week.
- Percentage difference between microclimate and non-microclimate simulations.
- Measured yearly EUI (2023) from BCA records where matched data are available, reported as kWh/m2/year.
How to read the difference layers
Difference layers show the percentage change caused by replacing the baseline weather file with localized WRF-derived microclimate conditions: (ΔE = (EWRF - Ebaseline) / Ebaseline × 100%). Positive values indicate higher simulated energy use under localized microclimate conditions, while negative values indicate lower simulated energy use.
Validation and Interpretation
The research workflow evaluates both climate and energy modelling performance before using the results for spatial interpretation.
Important limitations
- The platform visualizes representative-week scenarios rather than every day of the year.
- Measured EUI is available only for matched benchmarking buildings, so many buildings have simulated data only.
- Building type, height, age, and operation schedules are harmonized from multiple sources and include uncertainty.
- WRF-derived wind fields are useful for spatial comparison but should be interpreted with more caution than temperature and humidity.
Publications
The platform is connected to the following peer-reviewed publication.
- Jie, P., Tian, S., Liu, P., Wang, J., Santamouris, M., Hu, M., & Shi, X. (2026). Microclimate-Integrated Urban Building Energy Modeling (MUBEM): Spatiotemporal analysis of climate-driven energy use in Shanghai and Singapore. Building and Environment, Article 114749. https://doi.org/10.1016/j.buildenv.2026.114749
Team
This project is developed and maintained by the Building Informatics and Operations Research (BIOR) Lab at the National University of Singapore.
The team members include: